Generating random points#
The code provides simple methods to generate uniform random
points. These random coordinates can be enhanced to draw samples from an array
of observed redshifts or weights, if desired, which allows to directly build a
Catalog of random points for correlation measurements.
The simplest methods generates randoms within a rectangular footprint on sky, i.e. in a fixed window of right ascension and declination:
import yaw
from yaw.randoms import BoxRandoms

generator = BoxRandoms(
    ra_min=0.0,
    ra_max=90.0,
    dec_min=0.0,
    dec_max=90.0,
    # redshifts=None,
    # weights=None,
    # seed: int = 12345,
)

cat = yaw.Catalog.from_random(
    "path/to/cache",
    generator,
    num_randoms=10_000_000,
    # patch_centers=None,
    patch_num=64,
    # overwrite=False,
    progress=True,  # shows a progress bar, default: False
)
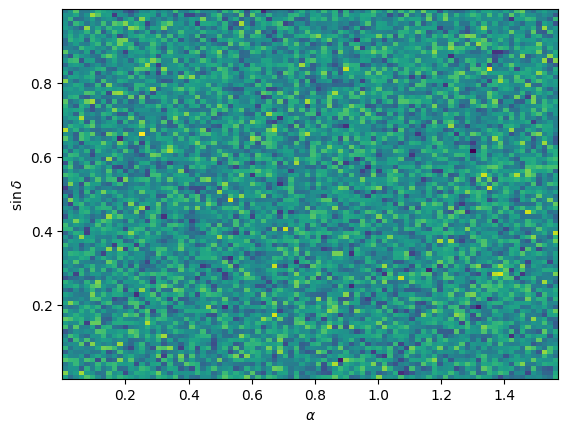
Example distribution of randomly generated points from the example above in an equal-area projection.#
The figure above can be generated with the following code:
import numpy as np
from matplotlib import pyplot as plt

# need to iterate over patches and load coordinates manually
coords = yaw.AngularCoordinates.from_coords(
    patch.coords for patch in cat.values()
)

plt.figure(dpi=100)
# histogram with equal area bins in ra/dec
plt.hist2d(coords.ra, np.sin(coords.dec), bins=90)
plt.xlabel(r"$\alpha$")
plt.ylabel(r"$\sin{\delta}$")
If healpy, the python wrapper for HealPix, is installed, random
points can also be generated in a HealPix-map. The map can be either
interpreted as a binary mask, or as in this example, as a density map,
where the map value is the relative probabilty of assigning random
points to each pixel.
For illustration purposes we generate a dummy map at the lowest possible map resolution, i.e. an array with 12 pixel values.
import yaw
from yaw.randoms import HealPixRandoms

dummy_map = range(12)  # the simplest possible map

generator = HealPixRandoms(
    pix_values=dummy_map,
    # is_mask = False,
    # redshifts=None,
    # weights=None,
    # seed: int = 12345,
)

cat = yaw.Catalog.from_random(
    "cache",
    generator,
    num_randoms=10_000_000,
    # patch_centers=None,
    patch_num=64,
    overwrite=True,
    progress=True,  # shows a progress bar, default: False
)
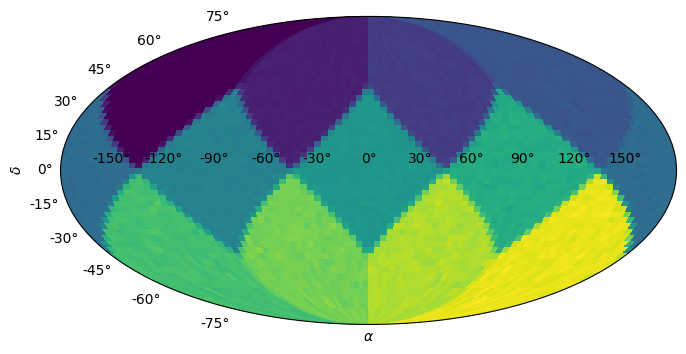
Example distribution of randomly generated points from the example above in an equal-area projection.#
The figure above can be generated with the following code:
import numpy as np
from matplotlib import pyplot as plt

# need to iterate over patches and load coordinates manually
coords = yaw.AngularCoordinates.from_coords(
    patch.coords for patch in cat.values()
)

plt.figure(dpi=100, figsize=(10, 4))
plt.subplot(1, 1, 1, projection="mollweide")  # equal area projection

# we cannot use plt.hist2d directly, so we use a trick to compute a
# histogram with equal area bins in ra/dec
ra_bins = np.linspace(0.0, 2.0 * np.pi, 91)
dec_bins = np.arcsin(np.linspace(-1.0, 1.0, 46))

hist, ra_bins, dec_bins = np.histogram2d(
    coords.ra, coords.dec, bins=(ra_bins, dec_bins)
)
plt.pcolor(ra_bins - np.pi, dec_bins, hist.T)

plt.xlabel(r"$\alpha$")
plt.ylabel(r"$\delta$")