yaw.redshifts.RedshiftData#
- class yaw.redshifts.RedshiftData(binning: IntervalIndex, data: NDArray, samples: NDArray, method: str, info: str | None = None)[source]#
Bases:
CorrDataContainer class object for redshift estimates.
Contains the redshift binning, estimated fraction of galaxies at the given redshift (not a density), and resampled fractions (e.g. from jackknife or bootstrap). The resampled values are used to compute error estimates and covariance/correlation matrices. Provides some plotting methods for convenience.
This container holds data in the form of \(\frac{w_\rm{sp}(z)}{\sqrt{\Delta z \, w_\rm{ss}(z) \, w_\rm{pp}(z)}}\), where \(w_\rm{sp}\) is the crosscorrelation function, and \(w_\rm{ss}\) and \(w_\rm{pp}\) are autocorrelation functions that account for the evolving galaxy bias. If no autocorrelation is provided, the data is still scaled by \(1/\Delta z\) compared to the crosscorrelation data in
CorrData.Note
This container should be constructed from a crosscorrelation measurement with one of the preferred methods
from_corrdata()orfrom_corrfuncs(). These additionally allow galaxy bias mitigation by specifying any additionally measured autocorrelation functions.The comparison, addition and subtraction and indexing rules are inherited from
SampledData, check the examples there.Examples
Create a redshift estimate from a crosscorrelation function and correct for the evolving bias of the reference sample using its autocorrelation function:
>>> from yaw.examples import w_sp  # crosscorrelation
>>> from yaw.examples import w_ss  # reference sample autocorrelation
>>> nz = yaw.yaw.RedshiftData.from_corrfuncs(w_sp, ref_corr=w_ss)
RedshiftData(n_bins=30, z='0.070...1.420', n_samples=64, method='jackknife')
Use a different estimator when sampling the autocorrelation function, e.g. the Peebles-Hauser estimator:
>>> nz = yaw.RedshiftData.from_corrfuncs(w_sp, ref_corr=w_ss, ref_est="PH")
RedshiftData(n_bins=30, z='0.070...1.420', n_samples=64, method='jackknife')
View the data for a subset of the redshift bins:
>>> nz.bins[5:9].data
array([2.5234212 , 1.96617211, 1.05342   , 0.67866257])
View the same subset as series:
>>> nz.bins[5:9].get_data()
(0.295, 0.34]    2.523421
(0.34, 0.385]    1.966172
(0.385, 0.43]    1.053420
(0.43, 0.475]    0.678663
dtype: float64
Get the redshift bin centers for these bins:
>>> nz.bins[5:9].mids
array([0.3175, 0.3625, 0.4075, 0.4525])
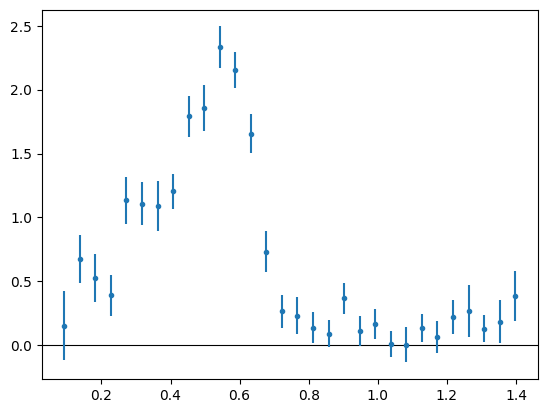
Plot the redshift distribution, indicating a zero-line
>>> nz.plot(zero_line=True)
<Axes: >
- Parameters:
binning (
pandas.IntervalIndex) – The redshift bin edges used for this correlation function.data (
NDArray) – The correlation function values.samples (
NDArray) – The resampled correlation function values.method (
str) – The resampling method used, seeResamplingConfigfor available options.info (
str, optional) – Descriptive text included in the headers of output files produced byCorrData.to_files().
Methods
__init__(binning, data, samples, method[, info])concatenate_bins(*data)Concatenate pair count data containers with equal patches.
from_corrdata(cross_data[, ref_data, ...])Compute redshift estimate from readily sampled function data.
from_correlation_data(*args, **kwargs)from_correlation_functions(*args, **kwargs)from_corrfuncs(cross_corr[, ref_corr, ...])Sample correlation functions to compute a redshift estimate.
from_files(path_prefix)Create a new instance by loading the data from ASCII files.
Get the underlying, exact redshift bin intervals.
Get value correlation matrix as data frame with its corresponding redshift bin intervals as index and column labels.
Get value covariance matrix as data frame with its corresponding redshift bin intervals as index and column labels.
get_data()Get the data as
pandas.Serieswith the binning as index.Get value error estimate (diagonal of covariance matrix) as series with its corresponding redshift bin intervals as index.
Get the data as
pandas.DataFramewith the binning as index.is_compatible(other[, require])Check whether this instance is compatible with another instance.
mean()Attempts to compute a mean redshift.
normalised([to])Obtain a normalised copy of the data.
plot(*[, color, label, error_bars, ax, ...])Create a plot of the correlation data as a function of redshift.
plot_corr(*[, redshift, cmap, ax])Plot the correlation matrix of the data.
rebin(bins)Attempts recomute the data for a different redshift binning.
shift([dz, amplitude])Attempts shift the data along the redshift axis.
to_files(path_prefix)Store the data in a set of ASCII files on disk.
Attributes
An
Indexerattribute that supports iteration over the bins or selecting a subset of the bins.Specifies on which side the redshift bin intervals are closed, can be:
left,right,both,neither.Get the width of the redshift bins as array.
Get the edges of the redshift bins as flat array.
The uncertainty (standard error) of the data.
Optional descriptive text for the contained data.
Get the centers of the redshift bins as array.
Get the number of redshift bins.
Number of samples used for error estimate.
The redshift bin intervals.
The data values, one for each redshift bin.
Samples of the data values, shape (# samples, # bins).
The resampling method used.
Covariance matrix automatically computed from the resampled values.
- binning: IntervalIndex#
The redshift bin intervals.
- property bins: Indexer[int | slice | Sequence, _Tdata]#
An
Indexerattribute that supports iteration over the bins or selecting a subset of the bins.The indexer always returns new container instances with the indexed data subset or the current item when iterating.
Warning
Indexing rules for a one-dimensional numpy array apply, however if the resulting binning is not contiguous or contains repeated bins, some operations on the returned container may fail.
- Returns:
yaw.core.containers.Indexer
- property closed: str#
Specifies on which side the redshift bin intervals are closed, can be:
left,right,both,neither.
- concatenate_bins(*data: _Tdata) _Tdata#
Concatenate pair count data containers with equal patches.
The data is merged by appending the data along the redshift binning axis.
Note
Necessary condition for merging is that the patch numbers are identical and that the merged binning is contiguous and non-overlapping. Cannot merge cross- with autocorrelation containers.
- Parameters:
*data – Containers of same type that are appended to the patch dimension of this container.
- Returns:
New instance of this container with combined data.
- covariance: NDArray#
Covariance matrix automatically computed from the resampled values.
- data: NDArray#
The data values, one for each redshift bin.
- property dz: ndarray[Any, dtype[float64]]#
Get the width of the redshift bins as array.
- property edges: ndarray[Any, dtype[float64]]#
Get the edges of the redshift bins as flat array.
- property error: NDArray#
The uncertainty (standard error) of the data.
- Returns:
NDArray
- classmethod from_corrdata(cross_data: CorrData, ref_data: CorrData | None = None, unk_data: CorrData | None = None, info: str | None = None) RedshiftData[source]#
Compute redshift estimate from readily sampled function data.
The required argument is a crosscorrelation measurement, additional parameters can specify sample autocorrelation measurements that are used to mitigate the evolving galaxy bias.
- Parameters:
cross_corr (
CorrData) – Data from the sampled cross-correlation function.ref_corr (
CorrData, optional) – Data from the sampled reference sample autocorrelation function. Used to mitigate reference bias evolution.unk_corr (
CorrData, optional) – Data from the sampled unknown sample autocorrelation function. Used to mitigate unknown bias evolution.
- Returns:
- classmethod from_correlation_data(*args, **kwargs)[source]#
Deprecated since version 2.3.2: Renamed to
from_corrdata().
- classmethod from_correlation_functions(*args, **kwargs)[source]#
Deprecated since version 2.3.2: Renamed to
from_corrfuncs().
- classmethod from_corrfuncs(cross_corr: CorrFunc, ref_corr: CorrFunc | None = None, unk_corr: CorrFunc | None = None, *, cross_est: str | None = None, ref_est: str | None = None, unk_est: str | None = None, config: ResamplingConfig | None = None, info: str | None = None) RedshiftData[source]#
Sample correlation functions to compute a redshift estimate.
The required argument is a crosscorrelation measurement, additional parameters can specify sample autocorrelation measurements that are used to mitigate the evolving galaxy bias.
- Parameters:
cross_corr (
CorrFunc) – The measured cross-correlation function.ref_corr (
CorrFunc, optional) – The measured reference sample autocorrelation function. Used to mitigate reference bias evolution.unk_corr (
CorrFunc, optional) – The measured unknown sample autocorrelation function. Used to mitigate unknown bias evolution.
- Returns:
- classmethod from_files(path_prefix: Path | str) _Tdata#
Create a new instance by loading the data from ASCII files.
The data is restored from a set of three input files produced by
to_files().Note
These file have the same names but different file extension, therefore only provide the base name without any extension to specifiy the input files.
- Parameters:
path_prefix (
str) – The base name of the input files without any file extension.- Returns:
CorrData
- get_binning() IntervalIndex#
Get the underlying, exact redshift bin intervals.
- Returns:
pandas.IntervalIndex
- get_correlation() DataFrame#
Get value correlation matrix as data frame with its corresponding redshift bin intervals as index and column labels.
- Returns:
pandas.DataFrame
- get_covariance() DataFrame#
Get value covariance matrix as data frame with its corresponding redshift bin intervals as index and column labels.
- Returns:
pandas.DataFrame
- get_data() Series#
Get the data as
pandas.Serieswith the binning as index.
- get_error() Series#
Get value error estimate (diagonal of covariance matrix) as series with its corresponding redshift bin intervals as index.
- Returns:
pandas.Series
- get_samples() DataFrame#
Get the data as
pandas.DataFramewith the binning as index. The columns are labelled numerically and each represent one of the samples.
- info: str | None = None#
Optional descriptive text for the contained data.
- is_compatible(other: SampledData, require: bool = False) bool#
Check whether this instance is compatible with another instance.
Ensures that both objects are instances of the same class, that the redshift binning is identical, that the number of samples agree, and that the resampling method is identical.
- Parameters:
other (
BinnedQuantity) – Object instance to compare to.require (
bool, optional) – Raise a ValueError if any of the checks fail.
- Returns:
bool
- mean()[source]#
Attempts to compute a mean redshift.
Warning
This should be just considered an estimate since the redshift estimate is not a true probability density, due to residual negative correlation amplitudes.
- Returns:
Mean redshift for the redshift data and its samples in a data container.
- Return type:
- method: str#
The resampling method used.
- property mids: ndarray[Any, dtype[float64]]#
Get the centers of the redshift bins as array.
- property n_bins: int#
Get the number of redshift bins.
- property n_samples: int#
Number of samples used for error estimate.
- normalised(to: CorrData | None = None) RedshiftData[source]#
Obtain a normalised copy of the data.
Either attempts to normalise the data by integration along the redshift axis or by fitting it to a provided reference data container (e.g. a known redshift distribution in a
HistDatacontainer).Note
The fit does not use the uncertainties but weights the data points inversely to their amplitude.
- Parameters:
to (
CorrData, optional) – Reference data to which the stored values are normalised by fitting.- Returns:
- plot(*, color: str | NDArray | None = None, label: str | None = None, error_bars: bool = True, ax: Axis | None = None, xoffset: float = 0.0, plot_kwargs: dict[str, Any] | None = None, zero_line: bool = False, scale_by_dz: bool = False) Axis#
Create a plot of the correlation data as a function of redshift.
Create a new axis or plot to an existing one, add x-axis offsets, if plotting multiple instances, or specify if the values should be represented as points with errorbars (default) or as line plot with shaded area to represent uncertainties.
- Parameters:
color – Valid
matplotlibcolor used for the error bars or the line and the shaded uncertainty area.label (
str, optional) – Plot label for the legend.error_bars (
bool, optional) – Whether to plot error bars (the default) or a line plot with shaded area.ax (plot axis, optional) – Optional
matplotlibaxis to plot into.xoffset (
int, optional) – Shift to apply to the x-axis (redshift) values.plot_kwargs (
dict, optional) – Parameters passed to theerrobar()orplot()plotting functions.zero_lilne (
bool, optional) – Wether to draw a thin black line that indicatesy=0.scale_by_dz (
bool, optional) – Whether to multiply the y-values by the redshift bin widthdz.
- plot_corr(*, redshift: bool = False, cmap: str = 'RdBu_r', ax: Axis | None = None) Axis#
Plot the correlation matrix of the data.
Create a new axis or plot to an existing one.
- Parameters:
redshift (
bool, optional) – Whether to map the matrix onto redshifts or as regular matrix plot (the default).cmap (
str, optional) – Name of amatplotlibcolormap to use.ax (plot axis, optional) – Optional
matplotlibaxis to plot into.
- rebin(bins: NDArray) RedshiftData[source]#
Attempts recomute the data for a different redshift binning.
Warning
The result may be inaccurate since the redshift estimate is not a true probability density, due to residual negative correlation amplitudes.
- Parameters:
bins (
NDArray) – Edges of the new redshift bins. May exceed or cover just a fraction of the original redshift range.- Return type:
- samples: NDArray#
Samples of the data values, shape (# samples, # bins).
- shift(dz: float | SampledValue = 0.0, *, amplitude: float | SampledValue = 1.0) RedshiftData[source]#
Attempts shift the data along the redshift axis.
The shifting is performed by recomputing the redshift estimate with its original redshift bins which are shifted by some amount.
Warning
The result may be inaccurate since the redshift estimate is not a true probability density, due to residual negative correlation amplitudes.
- Parameters:
dz (
SampledValueorfloat) – The amplitude of the shift along the redshift axis. If the input provides samples of the shift, each redshift estimate sample is shifted individually to obtain a more accurate error estimate.amplitude (
SampledValueorfloat) – An optional ampltude factor applied to the redshift estimate. Same rules as for thedzparameter.
- Return type:
- to_files(path_prefix: Path | str) None#
Store the data in a set of ASCII files on disk.
These files can be loaded with the
from_files()method. There are three files with the same name but different file extension.Files
[path_prefix].dat: Contains the redshift bin edges, the data values and their standard error. Additionally there is information about the error estimate and theinfoattribute.[path_prefix].smp: Contains one row for each redshift bin. The first two columns list the lower and upper edge of the redshift bin, the remaining columns list the values of the samples, i.e. there areN+2columns. Additionally contains theinfoattribute.[path_prefix].cov: Contains the covariance matrix and additionally theinfoattribute.- Parameters:
path_prefix (
str) – The base name of the output files without any file extension.